Liquidity Mapping Techniques That Reveal Hidden Patterns in Betting Exchange Dynamics Across Global Events
Harper Brooks · Aug 23, 2026

Liquidity Mapping Techniques That Reveal Hidden Patterns in Betting Exchange Dynamics Across Global Events
Betting exchanges operate through continuous order books where liquidity depth determines price stability and movement speed, and analysts apply mapping techniques to track these layers across multiple timeframes. Data from exchanges shows that volume clusters form at specific price levels during major events, creating visible patterns that repeat across tournaments and competitions held in different regions.
Core Components of Liquidity Mapping
Traders and researchers build maps by layering order book snapshots with executed trade data, which produces heatmaps that highlight accumulation zones and thin areas where prices accelerate. These visualizations combine bid-ask spreads, unmatched back and lay volumes, and time-stamped trade prints to show how liquidity shifts in response to in-play developments. Observers note that exchanges handling high global traffic maintain more granular records, allowing pattern detection at millisecond resolution during peak periods such as August 2026 international athletics meets.
Techniques Applied Across Markets
One established method stacks cumulative volume profiles by price increment, revealing where resting orders cluster before sudden breaks occur. Another approach overlays trade flow with liquidity withdrawal rates to isolate moments when large unmatched positions exit the book, often preceding sharp odds movements. Analysts combine these layers with cross-market correlation matrices that compare liquidity on soccer, tennis, and racing exchanges simultaneously, which exposes how capital migrates between event types when one market experiences a liquidity spike. Studies from the Australian Institute of Criminology indicate similar volume migration patterns appear in regulated exchange environments across multiple jurisdictions.
Revealing Patterns in Global Event Dynamics
During multi-week international competitions liquidity maps frequently display recurring structures such as pre-event buildup followed by rapid thinning once play begins. In August 2026, exchanges recorded pronounced liquidity pockets forming around halftime and set-piece moments in team sports, while individual events showed steadier depth until decisive points arrived. These maps also flag hidden correlations where liquidity on one exchange drains in tandem with volume surges on another platform, suggesting coordinated position adjustments across borders. Researchers at institutions tracking global gaming flows have documented how such synchronized movements intensify around championship finals and medal rounds.
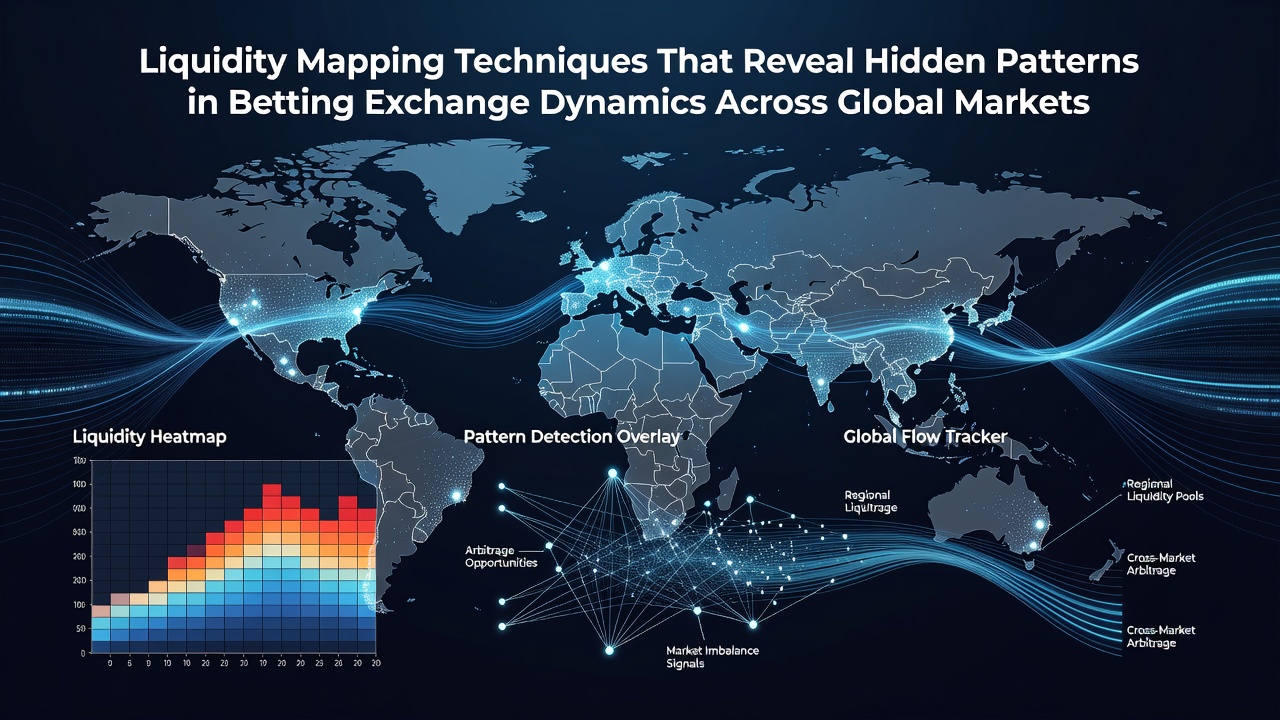
Additional techniques incorporate machine-readable order book imbalance ratios that update every few seconds, allowing detection of stealth accumulation where large lay orders sit just outside visible levels. When these ratios breach historical thresholds, subsequent price acceleration often follows within narrow windows. Data compiled across exchanges in different time zones shows that Asian market liquidity frequently absorbs European overnight flows before reversing direction at local event start times, creating predictable oscillation patterns visible only through layered mapping.
Cross-Regional Observations and Data Integration
Integration of regulatory filings from bodies such as the Nevada Gaming Control Board with exchange-level data provides broader context for liquidity behavior during overlapping global calendars. When North American markets open during European evening events, mapped liquidity often shifts toward higher-stakes tiers on the same outcomes, altering depth distribution for several hours. Those analyzing these shifts report that combining public regulatory aggregates with private exchange feeds produces more complete pictures of how capital rotates across continents. What's interesting is how these rotations leave traceable footprints in the form of repeated imbalance signatures that persist across successive tournaments.
Conclusion
Liquidity mapping therefore functions as a diagnostic layer that converts raw exchange data into structured views of depth, flow, and correlation. When applied consistently across global calendars, these techniques surface repeatable structures that appear in different sports and regions, offering measurable insight into how betting exchange dynamics evolve before, during, and after major events.